
IMPORTANT! Ensure Data is Sorted in the X-Direction
The number one fundamental for high performance in SciChart is to ensure that data is sorted in the X-Direction increasing. As of SciChart 3.0 and above, this is not mandatory, but several key algorithms such as HitTest, Indexing and Resampling require that data is sorted in the X-Direction for optimum performance. With unsorted data, SciChart will still render, but it will do so using vastly inferior algorithms.
Since SciChart v6 we have vastly improved the performance of charts with unsorted data, however, with sorted, you can achieve 1-Billion data-points. With unsorted, about 10,000,000 points.
We recommend if you can, sort.
To enable unsorted data
SciChart will throw an exception if you append unsorted data to a DataSeries. This is intended to warn you and prevent unintentional appending of unsorted data to a DataSeries.
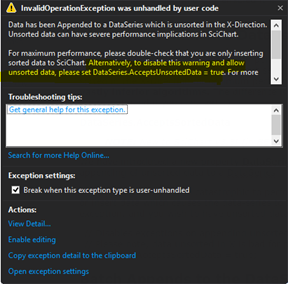
Since unsorted data is detrimental to performance, in SciChart v4+ we now throw an InvalidOperationException if you append or insert data which causes the data-series to be unsorted in the X-Direction. If you upgrade and see this exception, and you intend to have unsorted data in a data-series, you can disable the error by setting the following property:
| To enable unsorted data |
Copy Code |
|---|---|
// Disables exception on append unsorted data // Please note, data unsorted in X is bad for performance of large datasets. // Don't do it unless you need to! DataSeries.AcceptsSortedData = true; | |
Batch Appends to the DataSeries, using the overloaded API
Batching appends using the overloaded API to append IEnumerable, IList or Arrays has a massive impact on DataSeries performance. Arrays have the biggest impact as these can be indexed using unsafe code. If you have a lot of data to append, create a small buffer (say 10-100 points) and append them in blocks.
| Batch Appends to the DataSeries, using the overloaded API |
Copy Code |
|---|---|
double [] xBuffer = new double[100]; double [] yBuffer = new double[100]; for(int i = 0; i < 100; i++) { xBuffer[i] = GetNextXValue(i); yBuffer[i] = GetNextYValue(i); } // Single recalculation of Min, Max and Single // redraw call is executed when appending a block // Appending arrays is much faster than IEnumerables dataSeries.Append(xBuffer, yBuffer); | |
NOTE: Why does this work? When data is appended in blocks, you get a single draw call at the end. You also reduce thread-contention if you are appending on a background thread and drawing on the UI thread. Finally, the above is simply more memory efficient as we only need to recalculate the additional memory required once, rather than per-point appended.
SciChart processes data so fast, we can process >100,000 updates to the DataSeries per second. However, if you update that fast, then SciChart will spend a lot of time in static overhead for dataseries updates. It's better for performance to update more data, less often.
Batch updates inside a SciChartSurface.SuspendUpdates() using block
When performing multiple updates, such as VisibleRange changes, DataSeries changes and RenderableSeries or Axis Property changes, each change can potentially trigger a redraw in SciChart. To prevent this, use the methods from the ISuspendable implementation on SciChartSurface.
| Batch updates inside a SciChartSurface.SuspendUpdates() using block |
Copy Code |
|---|---|
using (sciChartSurface.SuspendUpdates()) { dataSeries.Append(x1, y1); dataSeries.Append(x2, y2); dataSeries.Append(x3, y4); sciChartSurface.YAxis.VisibleRange = new DoubleRange(200, 300); sciChartSurface.XAxis.VisibleRange = new DoubleRange(-10, 10); } // Single redraw call is executed on exit of using block | |
Batch Add Annotations if UIElement Annotations are Slow
When appending lots of annotaitons you will notice WPF really slows down and is unable to cope with more than a few thousand annotations.
If you need to append a large amount of annotations to a SciChartSurface, we recommend manipulating a new AnnotationCollection and attaching the whole collection to the chart, as opposed to manipulating the SciChartSurface.Annotations collection one by one.
| Batch Add Annotations if UIElement Annotations are Slow |
Copy Code |
|---|---|
using (sciChartSurface.SuspendUpdates()) { // Create temporary AnnotationCollection var myAnnotations = new AnnotationCollection(); double minx = double.MaxValue; double maxx = double.MinValue; for (int i = 0; i < 1000; i++) { var a = new BoxAnnotation { // Assign X1,Y1, Background etc... }; myAnnotations.Add(a); } // Reassign annotation collection sciChartSurface.Annotations = myAnnotations; sciChartSurface.ZoomExtents(); } | |
Data Distribution Hints — Skipping Expensive Scans on Data Load
When a DataSeries is populated or updated, SciChart determines several properties of the dataset: whether X values are sorted, whether X spacing is uniform, whether the data contains NaN or boundary values, and what the data ranges are. For general-purpose use this analysis runs automatically, but it requires an O(N) scan of the entire dataset on every initial load or large append. For datasets with millions of points, or for realtime scenarios where the caller already knows the data characteristics, this scan is pure overhead.
SciChart provides three DataDistributionArgs types that let you supply these facts upfront, allowing the engine to skip the scan entirely. Each type is tailored to a specific DataSeries family.
DataDistributionArgs (XyDataSeries)
DataDistributionArgs is a struct that describes the mathematical properties of an X-Y dataset. It is accepted as an optional parameter in the XyDataSeries constructor:
| Adding DataDistributionArgs to the XyDataSeries constructor |
Copy Code |
|---|---|
var dataSeries = new XyDataSeries<double, double>( xValues, yValues, dataDistributionArgs: new DataDistributionArgs { IsDataSortedAscending = true, IsDataEvenlySpaced = true, DoesDataContainNaN = false, DoesDataContainBoundaryValues = false }); | |
The four properties and their performance impact:
- IsDataSortedAscending — the most impactful flag. When true, SciChart enables its high-performance resampling algorithms (MinMax and MinMaxWithUnevenSpacing) and can compute the full data range from the first and last X values in O(1). When false or unknown, the engine falls back to a no-resampling path that is orders of magnitude slower for large datasets. If you know your data is sorted, always declare it.
- IsDataEvenlySpaced — when true (and data is also sorted), SciChart selects the fastest MinMax resampling algorithm, which uses simple index-based bucketing without spacing calculations. When false, the slightly slower MinMaxWithUnevenSpacing algorithm is used. For uniformly sampled data (e.g., fixed sample rate), setting this flag yields a measurable throughput gain.
- DoesDataContainNaN — when false, SciChart skips NaN validation during rendering. This eliminates per-point NaN checks in the drawing pipeline.
- DoesDataContainBoundaryValues — when false, the renderer can skip checks for Double.MaxValue, Double.NegativeInfinity, and similar special values.
When DataDistributionArgs is not provided, SciChart runs an O(N) scan on the initial data to determine all four properties automatically. For a dataset with 10 million points, this scan alone can take tens of milliseconds. Providing the hints eliminates it completely.
How It Affects the Rendering Pipeline
The data resampling algorithm is chosen based on the distribution flags. The fastest MinMax resampling reduces millions of data points to a few thousand screen pixels in a single pass. Without it, every data point must be individually transformed and drawn.
UniformDataDistributionArgs (UniformXyDataSeries)
UniformXyDataSeries stores only Y values — X values are computed implicitly from XStart and XStep. The data is always sorted and evenly spaced in X by definition, so those flags are hardcoded to true internally. However, the engine still needs to know about Y-value properties. UniformDataDistributionArgs<TX> provides these hints:
| Adding UniformDataDistributionArgs |
Copy Code |
|---|---|
var dataSeries = new UniformXyDataSeries<double>( xStart: 0.0, xStep: 0.001, yValues: largeYArray, dataDistributionArgs: new UniformDataDistributionArgs<double>( doesYDataContainNaN: false, doesYDataContainBoundaryValues: false, expectedYMin: -1.0, expectedYMax: 1.0)); | |
Properties:
- DoesYDataContainNaN — when false, NaN validation of Y values is skipped. Same effect as the corresponding flag in DataDistributionArgs, but specific to Y since X is implicit.
- DoesYDataContainBoundaryValues — when false, boundary value checks on Y data are skipped.
- ExpectedYMin / ExpectedYMax — the known minimum and maximum Y values in the dataset. When provided, these values are passed directly to the resampling engine, skipping an O(N) scan of the Y column to determine the data range. This is particularly valuable for large datasets where the Y range is known in advance (e.g., sensor data with a known output range, or normalized data in [-1, 1]).
When no UniformDataDistributionArgs is provided, the constructor scans all Y values to detect NaN and boundary values. The Y range scan is deferred to the first render pass. Providing the hints eliminates both scans.
FieldDataDistributionArgs (Vector Field Data Series)
Vector field data series (UniformVectorFieldDataSeries and NonUniformVectorFieldDataSeries) face a different performance challenge: each vector has four components (X, Y, DX, DY), and the renderer must compute the magnitude sqrt(DX² + DY²) for every vector to resolve colors and apply length scaling. For a 200×200 grid (40,000 vectors), that is 40,000 square root operations on the first render. FieldDataDistributionArgs provides hints that bypass these computations:
| Defining FieldDataDistributionArgs hints |
Copy Code |
|---|---|
var hints = new FieldDataDistributionArgs { // Pre-computed magnitude array: avoids sqrt() per vector PrecomputedMagnitudes = magnitudeArray, // Known magnitude range: avoids O(N) min/max scan for colormap normalization MagnitudeRange = new DoubleRange(0.0, maxMagnitude), // Known spatial extents (including vector tips): avoids O(N) range scans XRange = new DoubleRange(xMin, xMax + maxDx), YRange = new DoubleRange(yMin, yMax + maxDy), // For static fields that never update at runtime IsStationary = true, }; var dataSeries = new UniformVectorFieldDataSeries( xStart, xStep, yStart, yStep, dx, dy, hints); | |
Properties and their effects:
- PrecomputedMagnitudes (double[]) — a pre-calculated array of sqrt(DX² + DY²) for each vector. When provided, the renderer uses this array directly instead of computing magnitudes internally. This is the single largest optimization for vector fields — it eliminates N square root operations on first render and every subsequent cache miss.
- MagnitudeRange (DoubleRange) — the known minimum and maximum magnitude values. Used for colormap normalization (mapping magnitude to a [0, 1] palette offset). Without it, the engine scans the entire magnitude array to find min/max.
- XRange / YRange (DoubleRange) — the known spatial extents of the field, including the tips of vectors (X + DX, Y + DY). Without these, GetXRange() and GetWindowedYRange() must scan all X, Y, DX, DY arrays to compute the full extent.
- IsStationary (bool) — when true, all internal caches (magnitude array, magnitude range, spatial ranges) are never invalidated on data change events. Use this for fields that are loaded once and never modified, such as a static background wind field. Avoids unnecessary cache rebuilds when other data on the chart changes.
- ChangedIndexRange (IndexRange) — for partial data updates, specifies which slice of the vector array was modified. Only that slice of the magnitude cache is recomputed; all other cached magnitudes are preserved. For a 40,000-vector field where only 100 vectors changed, this reduces recomputation from 40,000 sqrt() calls to 100.
- IsFullReplace (bool) — when true, the next update is treated as a complete data replacement and the entire magnitude cache is rebuilt. Overrides ChangedIndexRange.
Summary
All three DataDistributionArgs types follow the same principle: if you know something about your data that SciChart would otherwise have to discover by scanning, tell it upfront. The performance benefit scales with dataset size — the larger the data, the more expensive the scan, and the more you gain by skipping it.
DataDistributionArgs → XyDataSeries: skips O(N) sort/spacing/NaN detection; enables fast resampling algorithms.
UniformDataDistributionArgs → UniformXyDataSeries: skips O(N) Y-range and NaN scans; provides pre-known YMin/YMax to resampler.
FieldDataDistributionArgs → VectorFieldDataSeries: skips O(N) magnitude computation (sqrt per vector), range scans, and supports partial cache updates for realtime fields.
In all cases, providing incorrect hints (e.g., claiming data is sorted when it is not) will produce incorrect rendering. These are trust-based optimizations — the engine takes the caller at their word.